One of the great challenges in this course, and in all of science, is to think and transmit information in many dimensions.
For example, x-ray experiments and quantum mechanics tell us about electron density in 3-D space. To graph this in any simple way would seem to require 4 axes and 4-dimensional space, one each for x, y, z, and electron density.
An even worse example is graphing the potential energy of a molecule as the atoms move around. Here we need x, y, and z for each of the N atoms plus a final coordinate to denote energy. Plotting a 3N+1 dimensional graph is quite a challenge when we use 2-D paper!
To catch on quickly to the techniques and concepts we will need to address such problems, you should have thought carefully about what is going on in familiar plots that convey 3-D information in 2-D. Here are four examples and a few questions to tune up with.
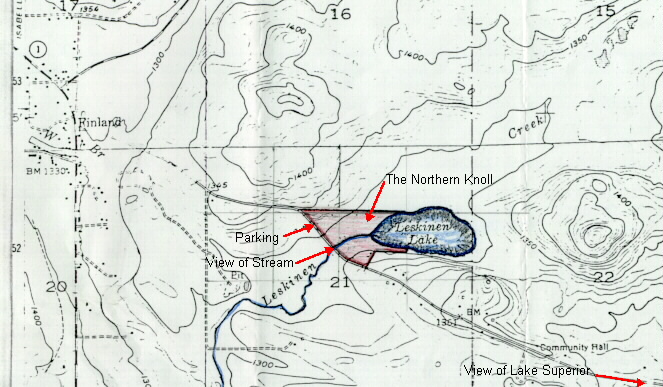
I. Topographic maps use contours to show altitude for various 2-D (EW and NS) positions. Here is an example:
QUESTION:
On this map locate a local maximum of altitude (hilltop), a local minimum of altitude, a valley, a steep hillside, and a pass between two valleys.
Does Leskinen Creek flow Northeast or Southwest?
How do you know?
II. Weather maps use contours to show pressure for various 2-D (EW and NS) positions. Here is an example (you can find an updated one by clicking here):
The white numbers denote atmospheric pressure in millibars (1000 mbar = 1 atmosphere)
QUESTIONS:
On this map use the contours to locate a local maximum of pressure, a local minimum of pressure, a "valley", a "steep hillside" (where winds should be high), and a "pass" (or "saddle-point" or "potato chip") joining two regions of low pressure.
What do you think of the positioning of H and L ?
III. There are alternatives to contour lines for coding electron density, or vegetation cover, or annual rainfall, or altitude, or whatever:
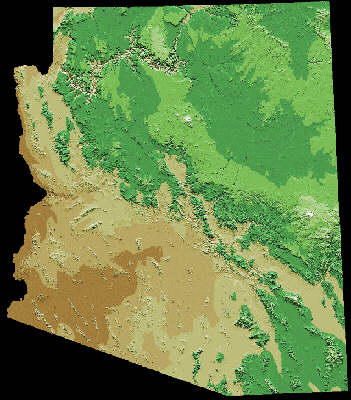
QUESTIONS:
How is the 3rd dimension coded in this graph?
Might there even be a 4th dimension? What is it? (This should make you appreciate clear identification of coordinates in a graph)
On this map locate a local maximum, a local minimum, a valley, a steep hillside, and a pass between two valleys.
IV. Here is a very different kind of 3-D graph.
QUESTIONS:
What are the dimensions?
How is the 3-Dness conveyed?
How might you use a different method to present the same information?
Which presentation is simpler?
Which is clearer?
|
|
|
|
Comments on this page are welcomed by the author.
J. Michael McBride
Department of
Chemistry, Yale University
Box 208107, New Haven, CT 06520-8107
e-mail: j.mcbride@yale.edu
text copyright © 2000,2003 J.M.McBride