(This page illustrates the complex
relationship between
basicity and
nucleophilicity, but its more important
general lesson is that when looking for relationships between
properties it is usually valuable to compare
logs
of rate and equilibrium constants with one another or with energies)
One of the most powerful tools in organic chemistry is making correlations between related properties. This allows understanding one phenomenon through its relationship to another, or predicting variations in one property on the basis of knowledge of another.
For example one might imagine that the ability of high HOMO molecules to bind to the low LUMO of a proton (their basicity) might correlate with the ability of the same high HOMOs to bind to the σ* orbital of a substrate in the transition state for nucleophilic substitution (their nucleophilicity).
Basicity concerns an equilibrium constant, Ka, between a base and its conjugate acid:

Nucleophilicity involves the rate constant, k, for a nucleophilic substitution reaction:
 |
or |
|
At first glance Ka and k look as different as apples and oranges. How should we go about correlating them?
We know that both Ka and k are related to free energies. For example at room temperature:
|
|
|
|
|
|
|
|
|
Similarly, the change in log(k) with the same change in nature of the nucleophile measures the corresponding change in ΔG*.
If there is a relationship between the influence of the substitutents on ΔG and their influence on ΔG*, a plot of pKa vs. log(k) should reveal it.
For example, if the influence of substituents on the two phenomena is of precisely the same sort but twice as large on ΔG as on ΔG*, the plot should be linear with a slope of 2.
On the other hand, if the influence of the substituents on the energies for the two processes are of different sorts, there is no reason for the plot to show any sort of simple pattern. The plot below shows that for the nucleophiles in Table 6.6 (p. 229) of Jones, there is no single simple relationship between the phenomena of nucleophilicity and basicity. For example, we know that the halides (blue line) are "backwards" in nucleophilicity in protic solvents because of how H-bonding related to anion size. This shows that nucleophilicity is a complicated property, and we shouldn't be too disappointed if we can't easily make reliable a priori predictions about it based on our knowledge of basicity. Ignoring the halides, there is a general trend of stronger bases being better nucleophiles (red line), but there is a LOT of scatter. This makes predicting elimination/substitution ratios from first principles more complicated than we might have hoped, though we can note that OH- (and by extension RO-) should be especially good at promoting elimination.
One interesting observation is that basicity
varies much more drastically (range 1028) than
nucleophilicity (range 105) confirming Hammond's postulate
that there is more change in free energy with change of base for
conversion from ion to completely bonded form (equilibrium
association with the proton) than there is for conversion from ion to
partially bonded form (the transition state for nucleophilic
substitution).
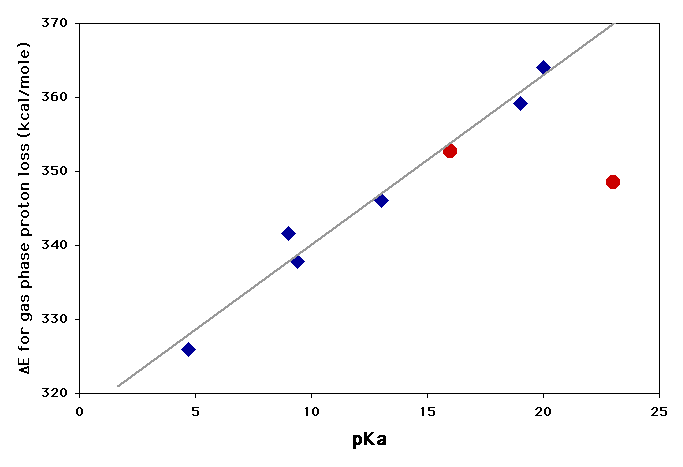
There are many cases where free energy correlations of this sort show very good straight lines, because the two phenomena being compared are both dependent on the same factors. The plot above shows that basicity and nucleophilicity in protic solvents is not one of these cases, but the following plot demonstrates a clear relationship (blue diamonds) between the ease of removing a proton from a carbon next to a carbonyl group in the gas phase (ΔE) and the ease of the same ionization in solution (pKa). The straight line shows that there is a close relationship between the factors that favor ionization of carbonyl compounds in solution and those that favor their ionization in the gas phase. The slope of the line shows that ΔE is twice as sensitive to the factors, however, since it covers a range of 40 kcal/mole where the pKa covers a range corresponding to only ~20 kcal/mole (103/4 x 20 = 1015 or 15 pKa units at room temperature).
The red points are for removing a proton from a carbon between two C=C double bonds. For at least one of these compounds there must be other factors that influence the acidity, since it does not fit the same relationship as the carbonyl compounds.

|
|
|